|
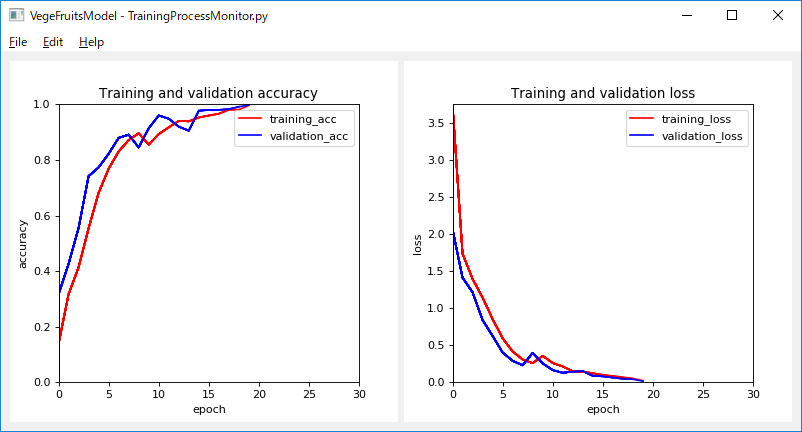
SOL4Py Sample: TrainingProcessMonitor
|

The above figure of 'TrainingProcessMonitor' is generated by the following model:
VegeFruitsModel
#******************************************************************************
#
#  Copyright (c) 2018-2019 Antillia.com TOSHIYUKI ARAI. ALL RIGHTS RESERVED.
#
#    This program is free software: you can redistribute it and/or modify
#    it under the terms of the GNU General Public License as published by
#    the Free Software Foundation, either version 3 of the License, or
#    (at your option) any later version.
#
#    This program is distributed in the hope that it will be useful,
#    but WITHOUT ANY WARRANTY; without even the implied warranty of
#    MERCHANTABILITY or FITNESS FOR A PARTICULAR PURPOSE.  See the
#    GNU General Public License for more details.
#
#    You should have received a copy of the GNU General Public License
#    along with this program.  If not, see <http://www.gnu.org/licenses/>.
#
#******************************************************************************


# 2019/05/10

# TrainingProcessMonitor.py
#

import sys
import signal
import numpy as np
import traceback
import matplotlib
import matplotlib.pyplot as plt
import seaborn as sns
import pandas as pd
import threading
import time

from numpy.random import rand


sys.path.append('../')

from SOL4Py.ZApplicationView  import *

from SOL4Py.ZPlottingArea  import *
from SOL4Py.keras.ZEpochLogServer import *

class MainView(ZApplicationView):

  ## Inner class starts.
  class EpochLogServer(ZEpochLogServer):

    ##
    # Constructor
    def __init__(self, view, ipaddress, port):
      ZEpochLogServer.__init__(self, ipaddress, port)
      # The values loss and acc may be plotted on figure of matplotlib
      self.view   = view
      self.clear()


    def clear(self):
      print("clear")
      self.x = []
      self.y_loss     = []
      self.y_acc      = []
      self.y_val_loss = []
      self.y_val_acc  = []
      self.max_loss  = 3

      self.x.append(0.0)
      self.y_loss.append(0.0)
      self.y_acc .append(0.0)
      self.y_val_loss.append(0.0)
      self.y_val_acc .append(0.0)

      self.update_accuray_plotting()
      self.update_loss_plotting()


    #
    def request_handle_callback(self, bytes, writer):
      print(__class__.__name__ + "::" + __class__.request_handle_callback.__name__ + " start")
      text = bytes.decode("utf-8")
      print(text)
      if "on_train_begin" in text:
        if ":" in text:
          _, notifier, epochs = text.split(":")
          self.view.set_filenamed_title(notifier)
          self.view.update_epochs(int(epochs))

        self.clear()

      if "," in text:
        epoch, loss, acc, val_loss, val_acc = text.split(",")
        print("{} {} {} {}".format(loss, acc, val_loss, val_acc))

        self.x.append(int(epoch))

        self.y_loss.append(float(loss))
        self.y_acc .append(float(acc))

        self.y_val_loss.append(float(val_loss))
        self.y_val_acc .append(float(val_acc))

        self.update_accuray_plotting()
        self.update_loss_plotting()


    def update_accuray_plotting(self):
      self.view.update_plotter1(self.x, self.y_acc,      'red')
      self.view.update_plotter1(self.x, self.y_val_acc,  'blue')


    def update_loss_plotting(self):
      v1 = self.max_loss
      v2 = self.max_loss

      if len(self.y_loss) > 1:
        v1 = self.y_loss    [np.argmax(self.y_loss)]

      if len(self.y_val_loss) > 1:
        v2 = self.y_val_loss[np.argmax(self.y_val_loss)]

      print("loss v1:{} v2:{}".format(v1, v2))

      max_loss = v1
      if v2 > v1:
        max_loss= v2

      self.view.update_loss_max(max_loss)

      self.view.update_plotter2(self.x, self.y_loss,     'red')
      self.view.update_plotter2(self.x, self.y_val_loss, 'blue')

  ## Inner class ends.


  ##
  # Constructor

  def __init__(self, title, x, y, width, height, epochs=40, loss=3):
    super(MainView, self).__init__(title, x, y, width, height)

    self.epochs   = epochs # epoch
    self.stride   = 1.0
    self.accuracy = 1.0
    self.loss     = loss

    plt.subplots_adjust(wspace=0.4, hspace=0.8)

    # accuray_plotting
    self.plotter1 = ZPlottingArea(self, width/2, height)

    # loss_plotting
    self.plotter2 = ZPlottingArea(self, width/2, height)

    self.ax1  = self.plotter1.add(111)
    self.ax1.set_title("Training and validation accuracy")
    self.ax1.set_xlabel("epoch")
    self.ax1.set_ylabel("accuracy")

    self.ax2  = self.plotter2.add(111)
    self.ax2.set_title("Training and validation loss")
    self.ax2.set_xlabel("epoch")
    self.ax2.set_ylabel("loss")

    self.ax1.set_xlim(0, self.epochs)
    self.ax1.set_ylim(0, self.accuracy)

    self.ax2.set_xlim(0, self.epochs)
    self.ax2.set_ylim(0, self.loss)

    self.add(self.plotter1)
    self.add(self.plotter2)


    self.show()

    # Create a thread and start it.
    self.thread = self.EpochLogServer(self, ipaddress = "127.0.0.1", port= 7777)
    self.thread.start()


  def file_save(self):
    try:
      abs_current_path = os.path.abspath(os.path.curdir)
      files_types = "PDF (*.pdf);;PGF (*.pgf);;PNG (*.png);;PS (*.ps);;EPS (*.eps);;RAW (*.raw);;RGBA (*.rgba);;SVG (*.svg);;SVGZ (*.svgz)"
      filename, _ = QFileDialog.getSaveFileName(self, "FileSaveDialog",
                             os.path.join(abs_current_path, "figure.png"),
                             files_types)
      if filename:
        plt.savefig(filename)
    except:
      traceback.print_exc()

  # Plotting training and validation accuracy
  def update_plotter1(self, xs, ys, color):
    self.ax1.plot(xs, ys, color=color,  linestyle='solid')
    self.ax1.legend(["training_acc", "validation_acc"])
    self.plotter1.draw()


  # Plotting training and validation_loss
  def update_plotter2(self, xs, ys, color):
    self.ax2.plot(xs, ys, color=color,  linestyle='solid')
    self.ax2.legend(["training_loss", "validation_loss"])
    self.plotter2.draw()


  def update_epochs(self, epochs):
    self.epochs = epochs
    self.ax1.set_xlim(0, self.epochs)
    self.ax2.set_xlim(0, self.epochs)


  def update_loss_max(self, loss_max):
    self.ax2.set_ylim(0, loss_max)


  def file_quit(self):
    #print("file_quitt")
    self.thread.close()
    self.thread.join()
    print("Thread stopped")
    self.terminated = True
    self.close()


  def closeEvent(self, ce):
    # Call file_quit to terminate self.thread
    self.file_quit()


##############################################################
#
#
if main(__name__):

  try:
    name   = sys.argv[0]
    argc   = len(sys.argv)
    epochs = 40
    loss   = 3

    if argc == 2:
      epochs = int(sys.argv[1])
    if argc == 3:
      epochs = int(sys.argv[1])
      loss   = int(sys.argv[2])

    applet = QApplication(sys.argv)

    mainv = MainView(name, 40, 40, 800, 400, epochs= epochs, loss= loss)
    mainv.show()

    applet.exec_()

  except:
    traceback.print_exc()
  else:
    pass

  finally:
   pass
Last modified:20 Sep. 2019
