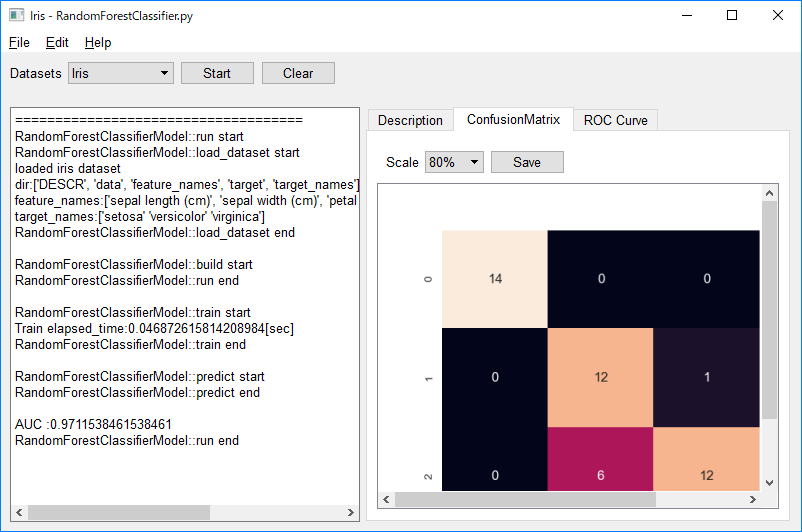
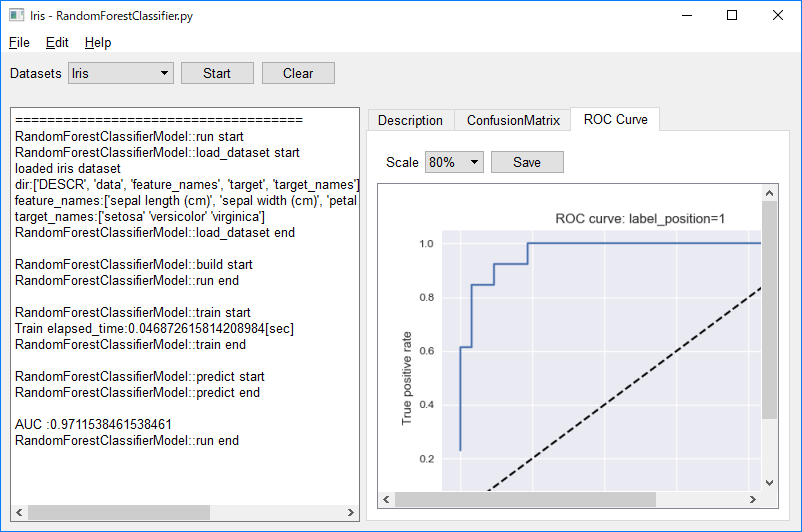
|
SOL4Py Sample: RandomForestClassifier
|


#******************************************************************************
#
#  Copyright (c) 2018 Antillia.com TOSHIYUKI ARAI. ALL RIGHTS RESERVED.
#
#    This program is free software: you can redistribute it and/or modify
#    it under the terms of the GNU General Public License as published by
#    the Free Software Foundation, either version 3 of the License, or
#    (at your option) any later version.
#
#    This program is distributed in the hope that it will be useful,
#    but WITHOUT ANY WARRANTY; without even the implied warranty of
#    MERCHANTABILITY or FITNESS FOR A PARTICULAR PURPOSE.  See the
#    GNU General Public License for more details.
#
#    You should have received a copy of the GNU General Public License
#    along with this program.  If not, see <http://www.gnu.org/licenses/>.
#
#******************************************************************************


# 2018/09/01

#  RandomForestClassifier.py
# This is base on the following sample program:
# http://scikit-learn.org/stable/auto_examples/ensemble/plot_feature_transformation.html
#
# Author: Tim Head <betatim@gmail.com>
#
# License: BSD 3 clause

# See also:

# http://scikit-learn.org/stable/modules/generated/sklearn.ensemble.RandomForestClassifier.html
# https://github.com/scikit-learn/scikit-learn/blob/f0ab589f/sklearn/ensemble/forest.py#L1019

#
# encodig: utf-8

import sys
import os
import cv2
import time
import traceback
import pandas as pd
import seaborn as sns

import matplotlib.pyplot as plt
import numpy as np

import pickle
from sklearn.linear_model import LogisticRegression
from sklearn.ensemble import RandomForestClassifier
from sklearn.preprocessing import OneHotEncoder
from sklearn.metrics import roc_curve
from sklearn.metrics import auc
from sklearn.metrics import confusion_matrix, classification_report

from sklearn.model_selection import train_test_split

from sklearn import datasets

from PyQt5.QtCore    import *
from PyQt5.QtWidgets import *
from PyQt5.QtGui     import *

sys.path.append('../')

from SOL4Py.ZMLModel         import *
from SOL4Py.ZApplicationView import *
from SOL4Py.ZLabeledComboBox import *
from SOL4Py.ZPushButton      import *
from SOL4Py.ZVerticalPane    import *
from SOL4Py.ZTabbedWindow    import *
from SOL4Py.ZScalableScrolledFigureView import *

Iris         = 0
Digits       = 1
Wine         = 2
BreastCancer = 3

############################################################
# Classifier Model clas

class RandomForestClassifierModel(ZMLModel):

  ##
  # Constructor
  def __init__(self, dataset_id, mainv):
    super(RandomForestClassifierModel, self).__init__(dataset_id, mainv)

    self.roc_label_position = 1

  def run(self):
    self.write("====================================")
    self._start(self.run.__name__)
    try:
      self.load_dataset()
      if self.trained():
        self.load()
      else:
        self.build()
        self.train()
        self.save()

      self.predict()
      self.visualize()

    except:
      traceback.print_exc()
    self._end(self.run.__name__)

  def load_dataset(self):
    self._start(self.load_dataset.__name__)

    if self.dataset_id == Iris:
       self.dataset= datasets.load_iris()
       self.write("loaded iris dataset")

    if self.dataset_id == Digits:
       self.dataset= datasets.load_digits()
       self.write("loaded Digits dataset")

    if self.dataset_id == Wine:
       self.dataset= datasets.load_wine()
       self.write("loaded Wine dataset")

    if self.dataset_id == BreastCancer:
       self.dataset= datasets.load_breast_cancer()
       self.write("loaded BreastCancer dataset")

    attr = dir(self.dataset)
    self.write("dir:" + str(attr))
    if "feature_names" in attr:
      self.write("feature_names:" + str(self.dataset.feature_names))
    if "target_names" in attr:
      self.write("target_names:" + str(self.dataset.target_names))

    self.set_model_filename()

    self.view.description.setText(self.dataset.DESCR)

    X, y = self.dataset.data, self.dataset.target

    self.X_train, self.X_test, self.y_train, self.y_test = train_test_split(X, y, test_size=0.3)

    self.X_train, self.X_train_lr, self.y_train, self.y_train_lr = train_test_split(self.X_train, self.y_train, test_size=0.3)
    self._end(self.load_dataset.__name__)

  def build(self):
    self._start(self.build.__name__)
    self.model = RandomForestClassifier(max_depth=10, n_estimators= 10)
    self.enc   = OneHotEncoder()
    self.lr    = LogisticRegression()

    self._end(self.run.__name__)

  def train(self):
    self._start(self.train.__name__)
    start = time.time()
    # Class fit method of the classifier
    self.model.fit(self.X_train, self.y_train)

    self.enc.fit(self.model.apply(self.X_train))
    self.lr.fit(self.enc.transform(self.model.apply(self.X_train_lr)), self.y_train_lr)

    elapsed_time = time.time() - start
    elapsed = str("Train elapsed_time:{0}".format(elapsed_time) + "[sec]")
    self.write(elapsed)
    self._end(self.train.__name__)


  def predict(self):
    self._start(self.predict.__name__)

    # RandomForestClassifer.predict
    self.pred_test  = self.model.predict(self.X_test)

    # Call LogisticRegression.predic_prob
    self.y_pred = self.lr.predict_proba(self.enc.transform(self.model.apply(self.X_test)))[:, 1]
    self._end(self.predict.__name__)


  def visualize(self):
   cmatrix = confusion_matrix(self.y_test, self.pred_test)
   false_positive_rate, true_positive_rate, _ = roc_curve(self.y_test, self.y_pred, pos_label=self.roc_label_position)

   self.view.visualize(cmatrix, false_positive_rate, true_positive_rate, self.roc_label_position)


############################################################
# Classifier View

class MainView(ZApplicationView):
  # Class variables

  # ClassifierView Constructor
  def __init__(self, title, x, y, width, height):
    super(MainView, self).__init__(title, x, y, width, height)
    self.font        = QFont("Arial", 10)
    self.setFont(self.font)

    # 1 Add a labeled combobox to top dock area
    self.add_datasets_combobox()

    # 2 Create a textedit to the left pane of the center area.
    self.text_editor = QTextEdit()
    self.text_editor.setLineWrapColumnOrWidth(600)
    self.text_editor.setLineWrapMode(QTextEdit.FixedPixelWidth)

    # 3 Create a description to display dataset.DESCR.
    self.description = QTextEdit()
    self.description.setLineWrapColumnOrWidth(600)
    self.description.setLineWrapMode(QTextEdit.FixedPixelWidth)

    # 4 Create a tabbed_window
    self.tabbed_window = ZTabbedWindow(self, 0, 0, width/2, height)

    # 5 Create a figure_view to the right pane of the center area.
    self.figure_view = ZScalableScrolledFigureView(self, 0, 0, width/2, height)

    # 6 Create a roc_curve to the right pane of the center area.
    self.roc_curve = ZScalableScrolledFigureView(self, 0, 0, width/2, height)

    self.add(self.text_editor)
    self.add(self.tabbed_window)

    self.tabbed_window.add("Description",  self.description)
    self.tabbed_window.add("ConfusionMatrix", self.figure_view)
    self.tabbed_window.add("ROC Curve", self.roc_curve)

    self.figure_view.hide()
    self.roc_curve.hide()

    self.show()

  def add_datasets_combobox(self):
    self.dataset_id = Iris
    self.datasets_combobox = ZLabeledComboBox(self, "Datasets", Qt.Horizontal)

    # We use the following datasets of sklearn to test RandomForestClassifier.
    self.datasets = {"Iris": Iris, "Digits": Digits, "Wine": Wine, "BreastCancer": BreastCancer}
    title = self.get_title()
    self.setWindowTitle( "Iris" + " - " + title)

    self.datasets_combobox.add_items(self.datasets.keys())
    self.datasets_combobox.add_activated_callback(self.datasets_activated)
    self.datasets_combobox.set_current_text(self.dataset_id)

    self.start_button = ZPushButton("Start", self)
    self.clear_button = ZPushButton("Clear", self)

    self.start_button.add_activated_callback(self.start_button_activated)
    self.clear_button.add_activated_callback(self.clear_button_activated)

    self.datasets_combobox.add(self.start_button)
    self.datasets_combobox.add(self.clear_button)

    self.set_top_dock(self.datasets_combobox)


  def write(self, text):
    self.text_editor.append(text)
    self.text_editor.repaint()

  def datasets_activated(self, text):
    self.dataset_id = self.datasets[text]
    title = self.get_title()
    self.setWindowTitle(text + " - " + title)

  def start_button_activated(self, text):
    self.model = RandomForestClassifierModel(self.dataset_id, self)
    self.start_button.setEnabled(False)
    self.clear_button.setEnabled(False)
    try:
      self.model.run()
    except:
      pass
    self.start_button.setEnabled(True)
    self.clear_button.setEnabled(True)


  def clear_button_activated(self, text):
    self.text_editor.setText("")
    self.description.setText("")

    self.figure_view.hide()
    self.roc_curve.hide()

    plt.close()

  def visualize(self, cmatrix, false_positive_rate, true_positive_rate, label_position):
    self.figure_view.show()
    plt.close()

    sns.set()
    df = pd.DataFrame(cmatrix)
    sns.heatmap(df, annot=True, fmt="d")
    # Set a new figure to the figure_view.
    self.figure_view.set_figure(plt)
    plt.close()

    self.roc_curve.show()

    self.write("AUC :" + str( auc(false_positive_rate, true_positive_rate) ))

    plt.plot([0, 1], [0, 1], 'k--')
    plt.plot(false_positive_rate, true_positive_rate, label='RT + LR')

    plt.xlabel('False positive rate')
    plt.ylabel('True positive rate')
    plt.title('ROC curve: label_position=' + str(label_position))
    plt.legend(loc='best')

    self.roc_curve.set_figure(plt)
    plt.close()


############################################################
#
if main(__name__):

  try:
    app_name  = os.path.basename(sys.argv[0])
    applet    = QApplication(sys.argv)

    main_view = MainView(app_name, 40, 40, 800, 500)
    main_view.show ()

    applet.exec_()

  except:
    traceback.print_exc()
Last modified: 6 May 2018

